14 01-kmeans-app
Challenge 4
Run this shiny app. Screenshot the app with Petal_Length by Sepal_Width selected.
palette(c("#E41A1C", "#377EB8", "#4DAF4A", "#984EA3",
  "#FF7F00", "#FFFF33", "#A65628", "#F781BF", "#999999"))

library(shiny)

#Let's remember what the dataset iris looks like
View(iris)

ui <- fluidPage(
  headerPanel('Iris k-means clustering'), #This is the title
  sidebarPanel( #This is the sidebar with buttons:
    selectInput('xcol', 'X Variable', names(iris)), #xcol is the value, X Variable the label
    selectInput('ycol', 'Y Variable', names(iris), #ycol is the value, Y Variable the label
      selected = names(iris)[[2]]),
    numericInput('clusters', 'Cluster count', 3,
      min = 1, max = 9)
  ),
  mainPanel(
    plotOutput('plot1')
  )
)


server <- function(input, output) {

  selectedData <- reactive({ #We'll talk about reactives in a bit
    iris[, c(input$xcol, input$ycol)]
  })

  clusters <- reactive({
    kmeans(selectedData(), input$clusters)
  })

  output$plot1 <- renderPlot({ #This creates the plot that you want to see
    #with dynamic changes
    par(mar = c(5.1, 4.1, 0, 1)) #this creates the window position
    plot(selectedData(), #The we plot the clusters from above with selectedData()
         col = clusters()$cluster, #How many clusters
         pch = 20, cex = 3) #Color and size default
    points(clusters()$centers, pch = 4, cex = 4, lwd = 4)
  })

}

shinyApp(ui = ui, server = server)
#>
#> Listening on http://127.0.0.1:7043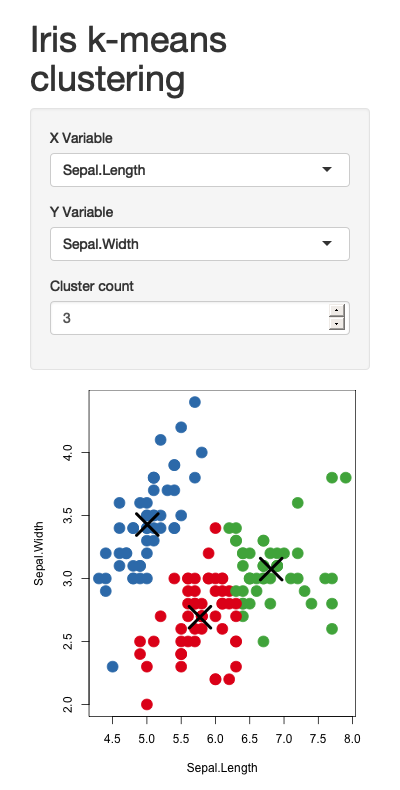
Challenge 5
Run your own data with the above code. See if you can replace the numeric variables of the iris dataset with your own. Screenshot the results.